
Redesigning how facilities see, and fix, their hardware remotely.
Project Vantiva
Category SaaS, CRM, IoT
Sole contributor. UX, UI
Contributors President, Head of Product, VP of Engineering, Marketing Director
01
Challenges
Two metrics were working against the business: install time and hardware monitoring.
Facilities teams managing hardware across large buildings had no centralized way to see device health. When something went wrong, the only path to fixing these issues was a physical one — locate the device, walk to it, troubleshoot it in person. For one enterprise client, that meant install processes involving manual scanning and entry took 12 hours, and full onsite install projects stretched 7 to 10 days.
On top of that, front-line staff had no way to resolve common hardware issues themselves. Every reboot, connectivity drop, or daisy-chaining problem meant a call to dev ops thereby tying up engineering time on repetitive, low-complexity requests.
Context & Constraints
The business wanted a fast fix — leadership was pushing for continuous delivery, shipping incremental updates immediately. But the real problem wasn't in the software layer we were already iterating on. It was upstream, in hardware and process.
That meant making a case for patience: pausing the incremental release cadence on our existing admin tool in favor of stepping back to understand the systemic issue first. The pitch to leadership was straightforward — a short-term slowdown in exchange for a fix that would meaningfully reduce strain on engineering and DevOps and deliver a much bigger win for customers.
02

Research & Discovery
Before any screens were designed, the work was entirely diagnostic. The goal was to solve the right problem, not just design a nicer interface around the existing one.
1
Interviews with facilities staff to understand where time was actually being lost during install and troubleshooting


Perplexity
Maze
Dovetail
2
Collaboration with the hardware vendor to understand device-level constraints and what data could realistically be exposed in software.


Broadcom
Qualcomm
3
Partnership with DevOps to identify the root time consumers. The small, repetitive support requests consuming the most engineering time.

Vantiva DevOps
03
The Approach
Remote Execution & Core Tasks
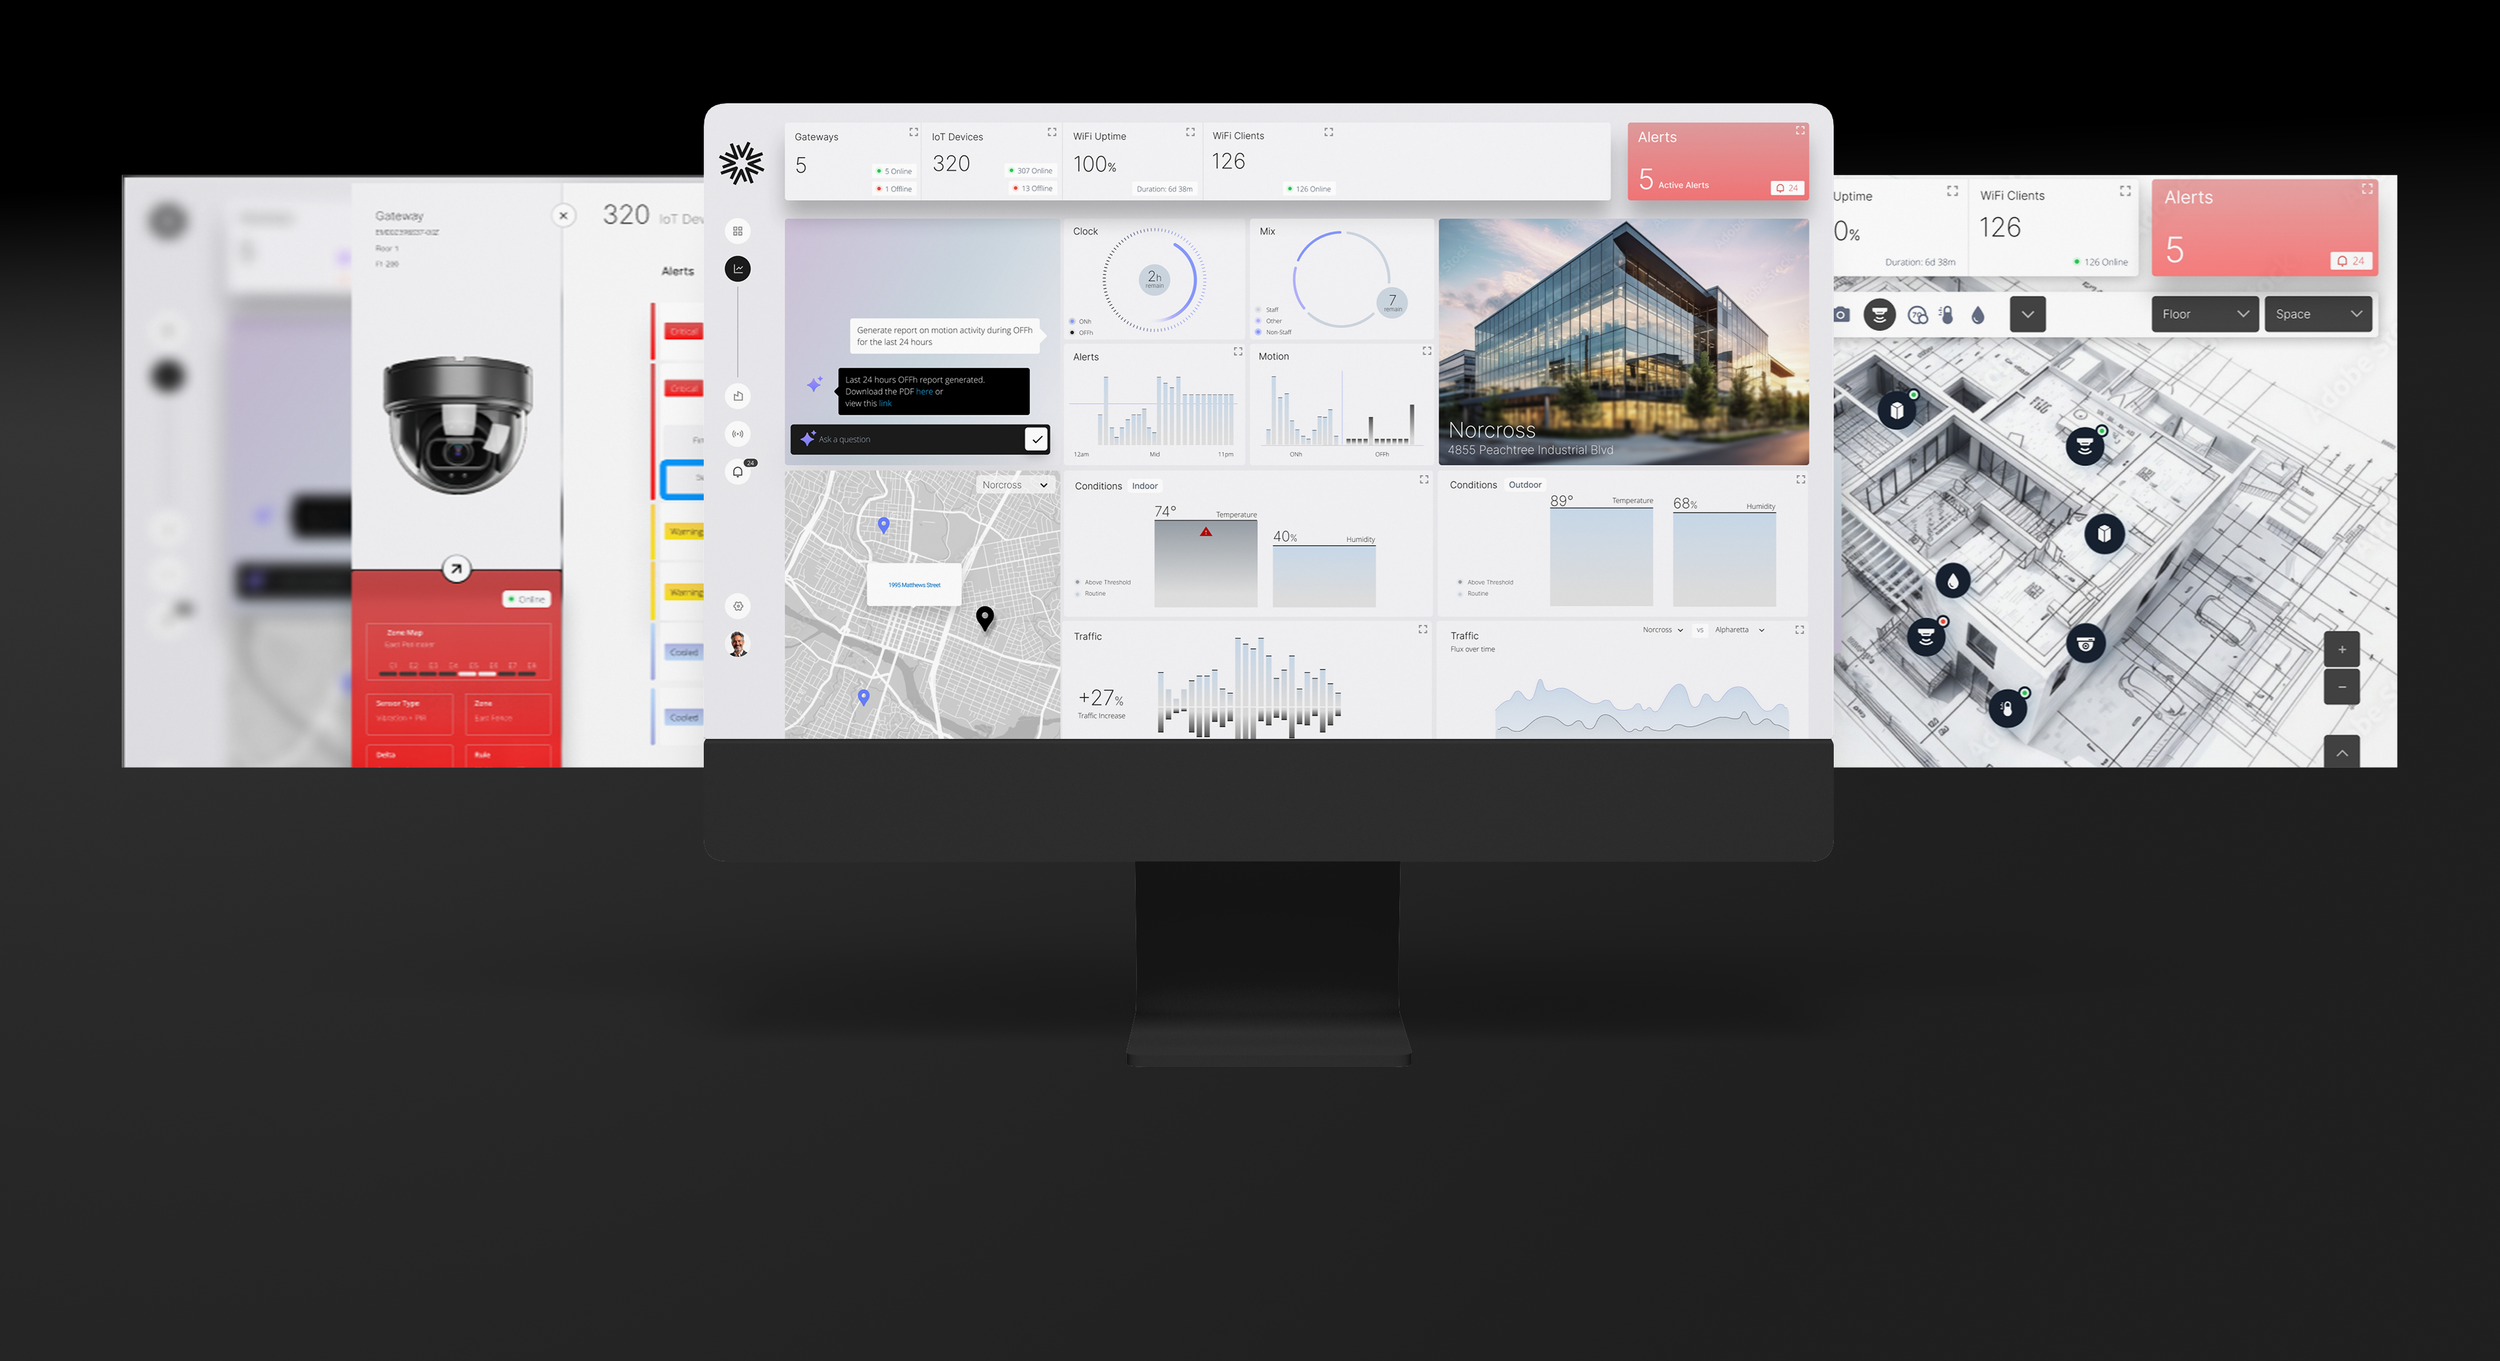
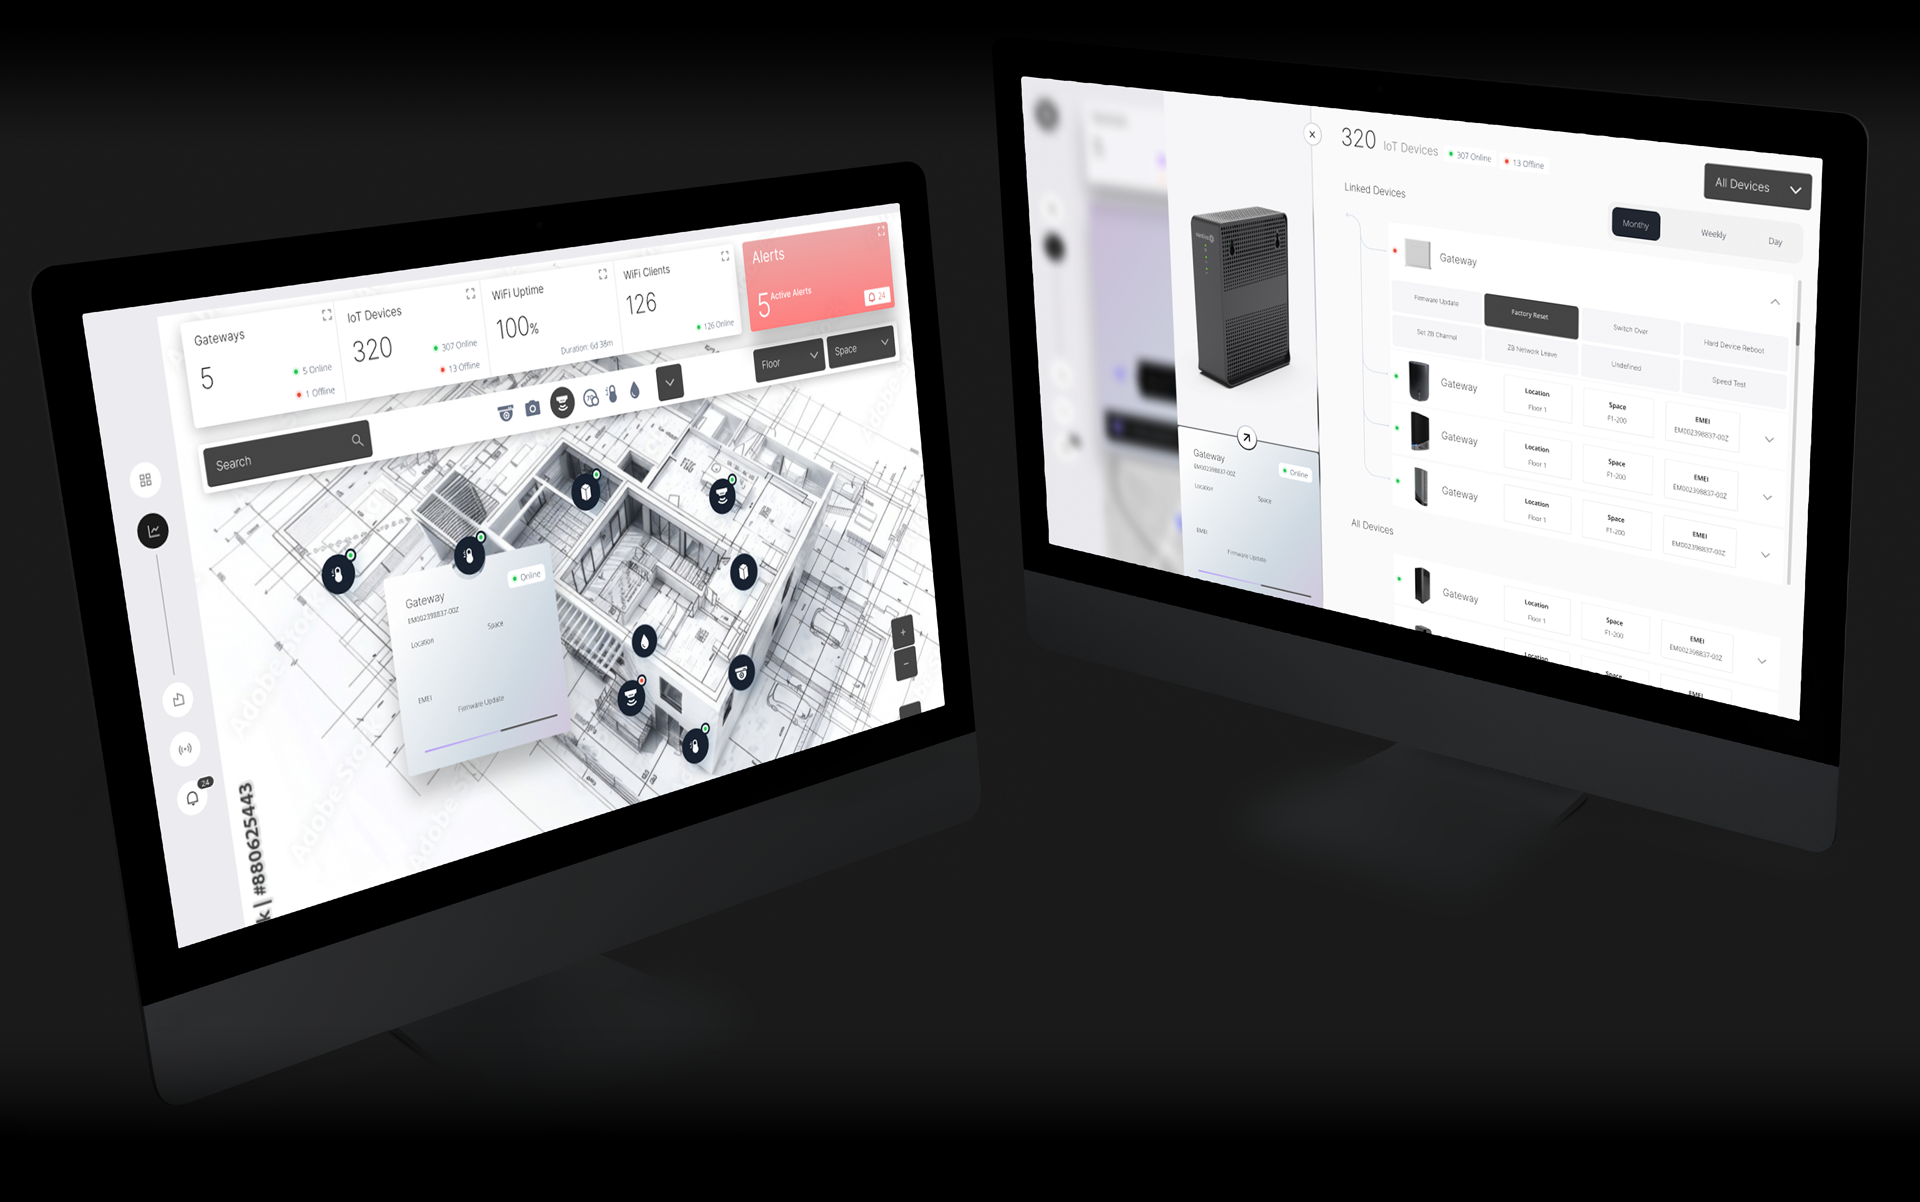
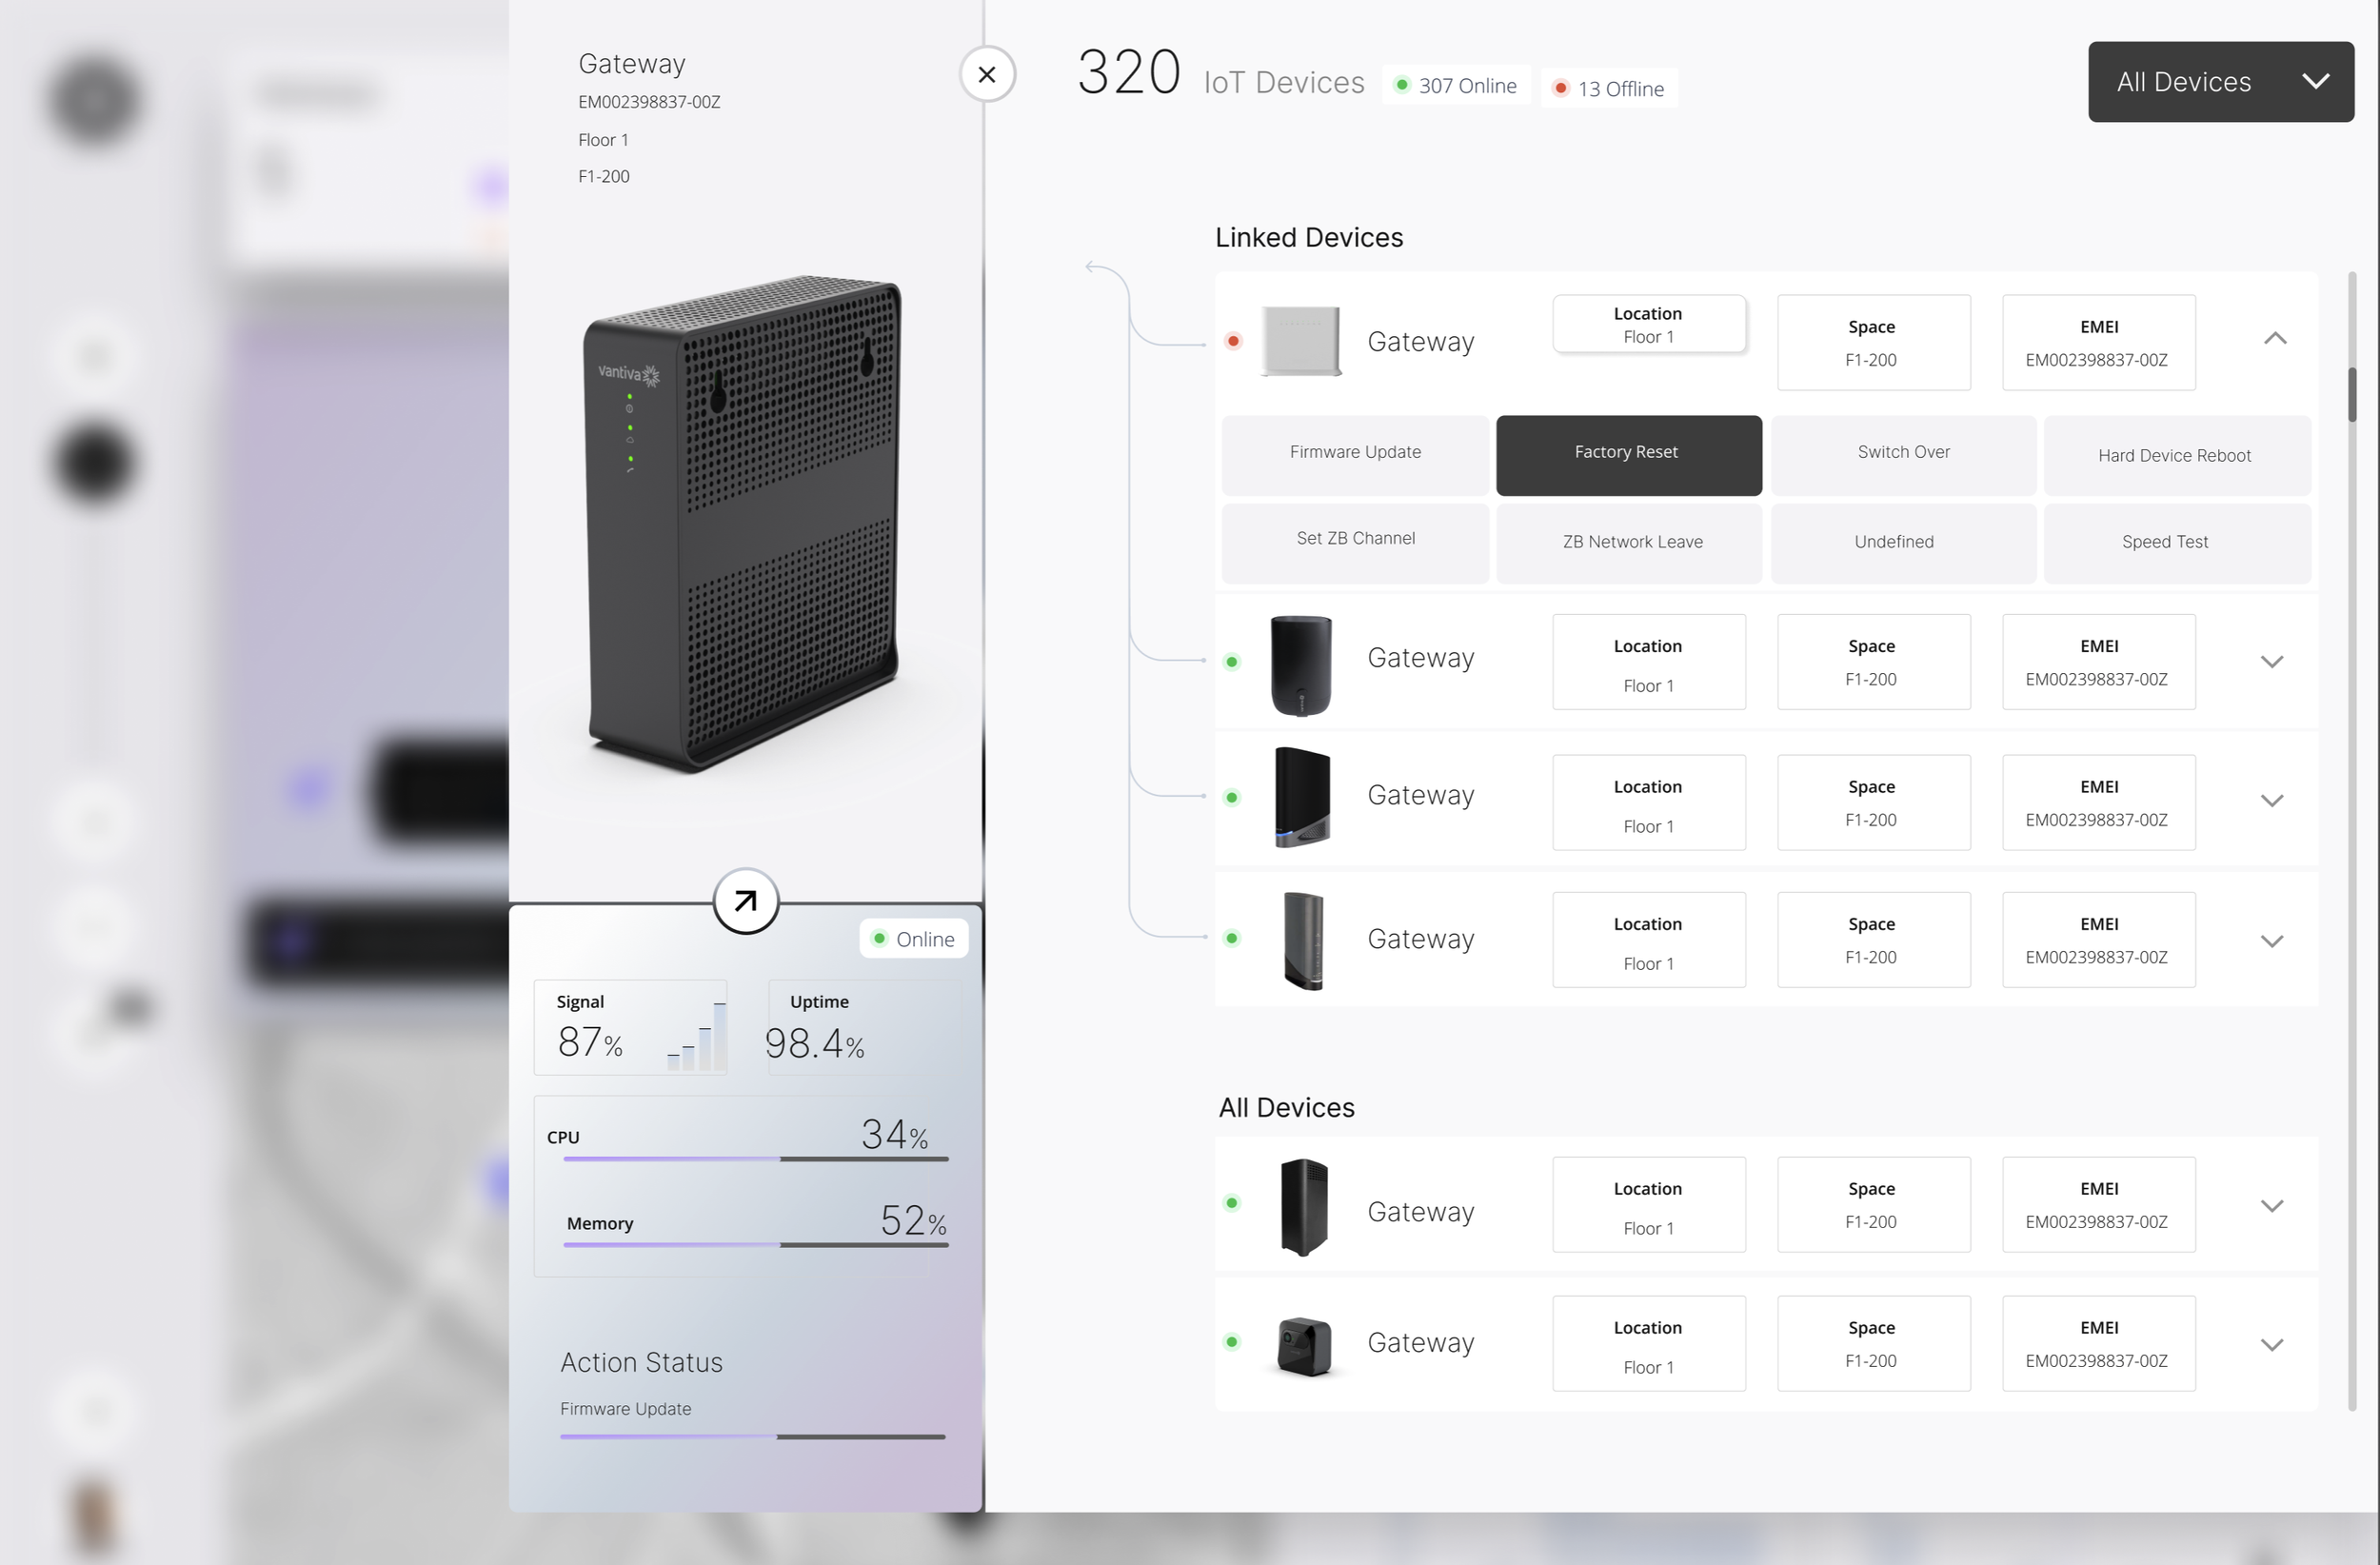
Working with clients and DevOps, we identified the seven most common support tasks. Reboot, restart, network connectivity checks, daisy-chaining, and more — working with the hardware team, we made these tasks executable directly through software, tied to a new topographic view of the facility.
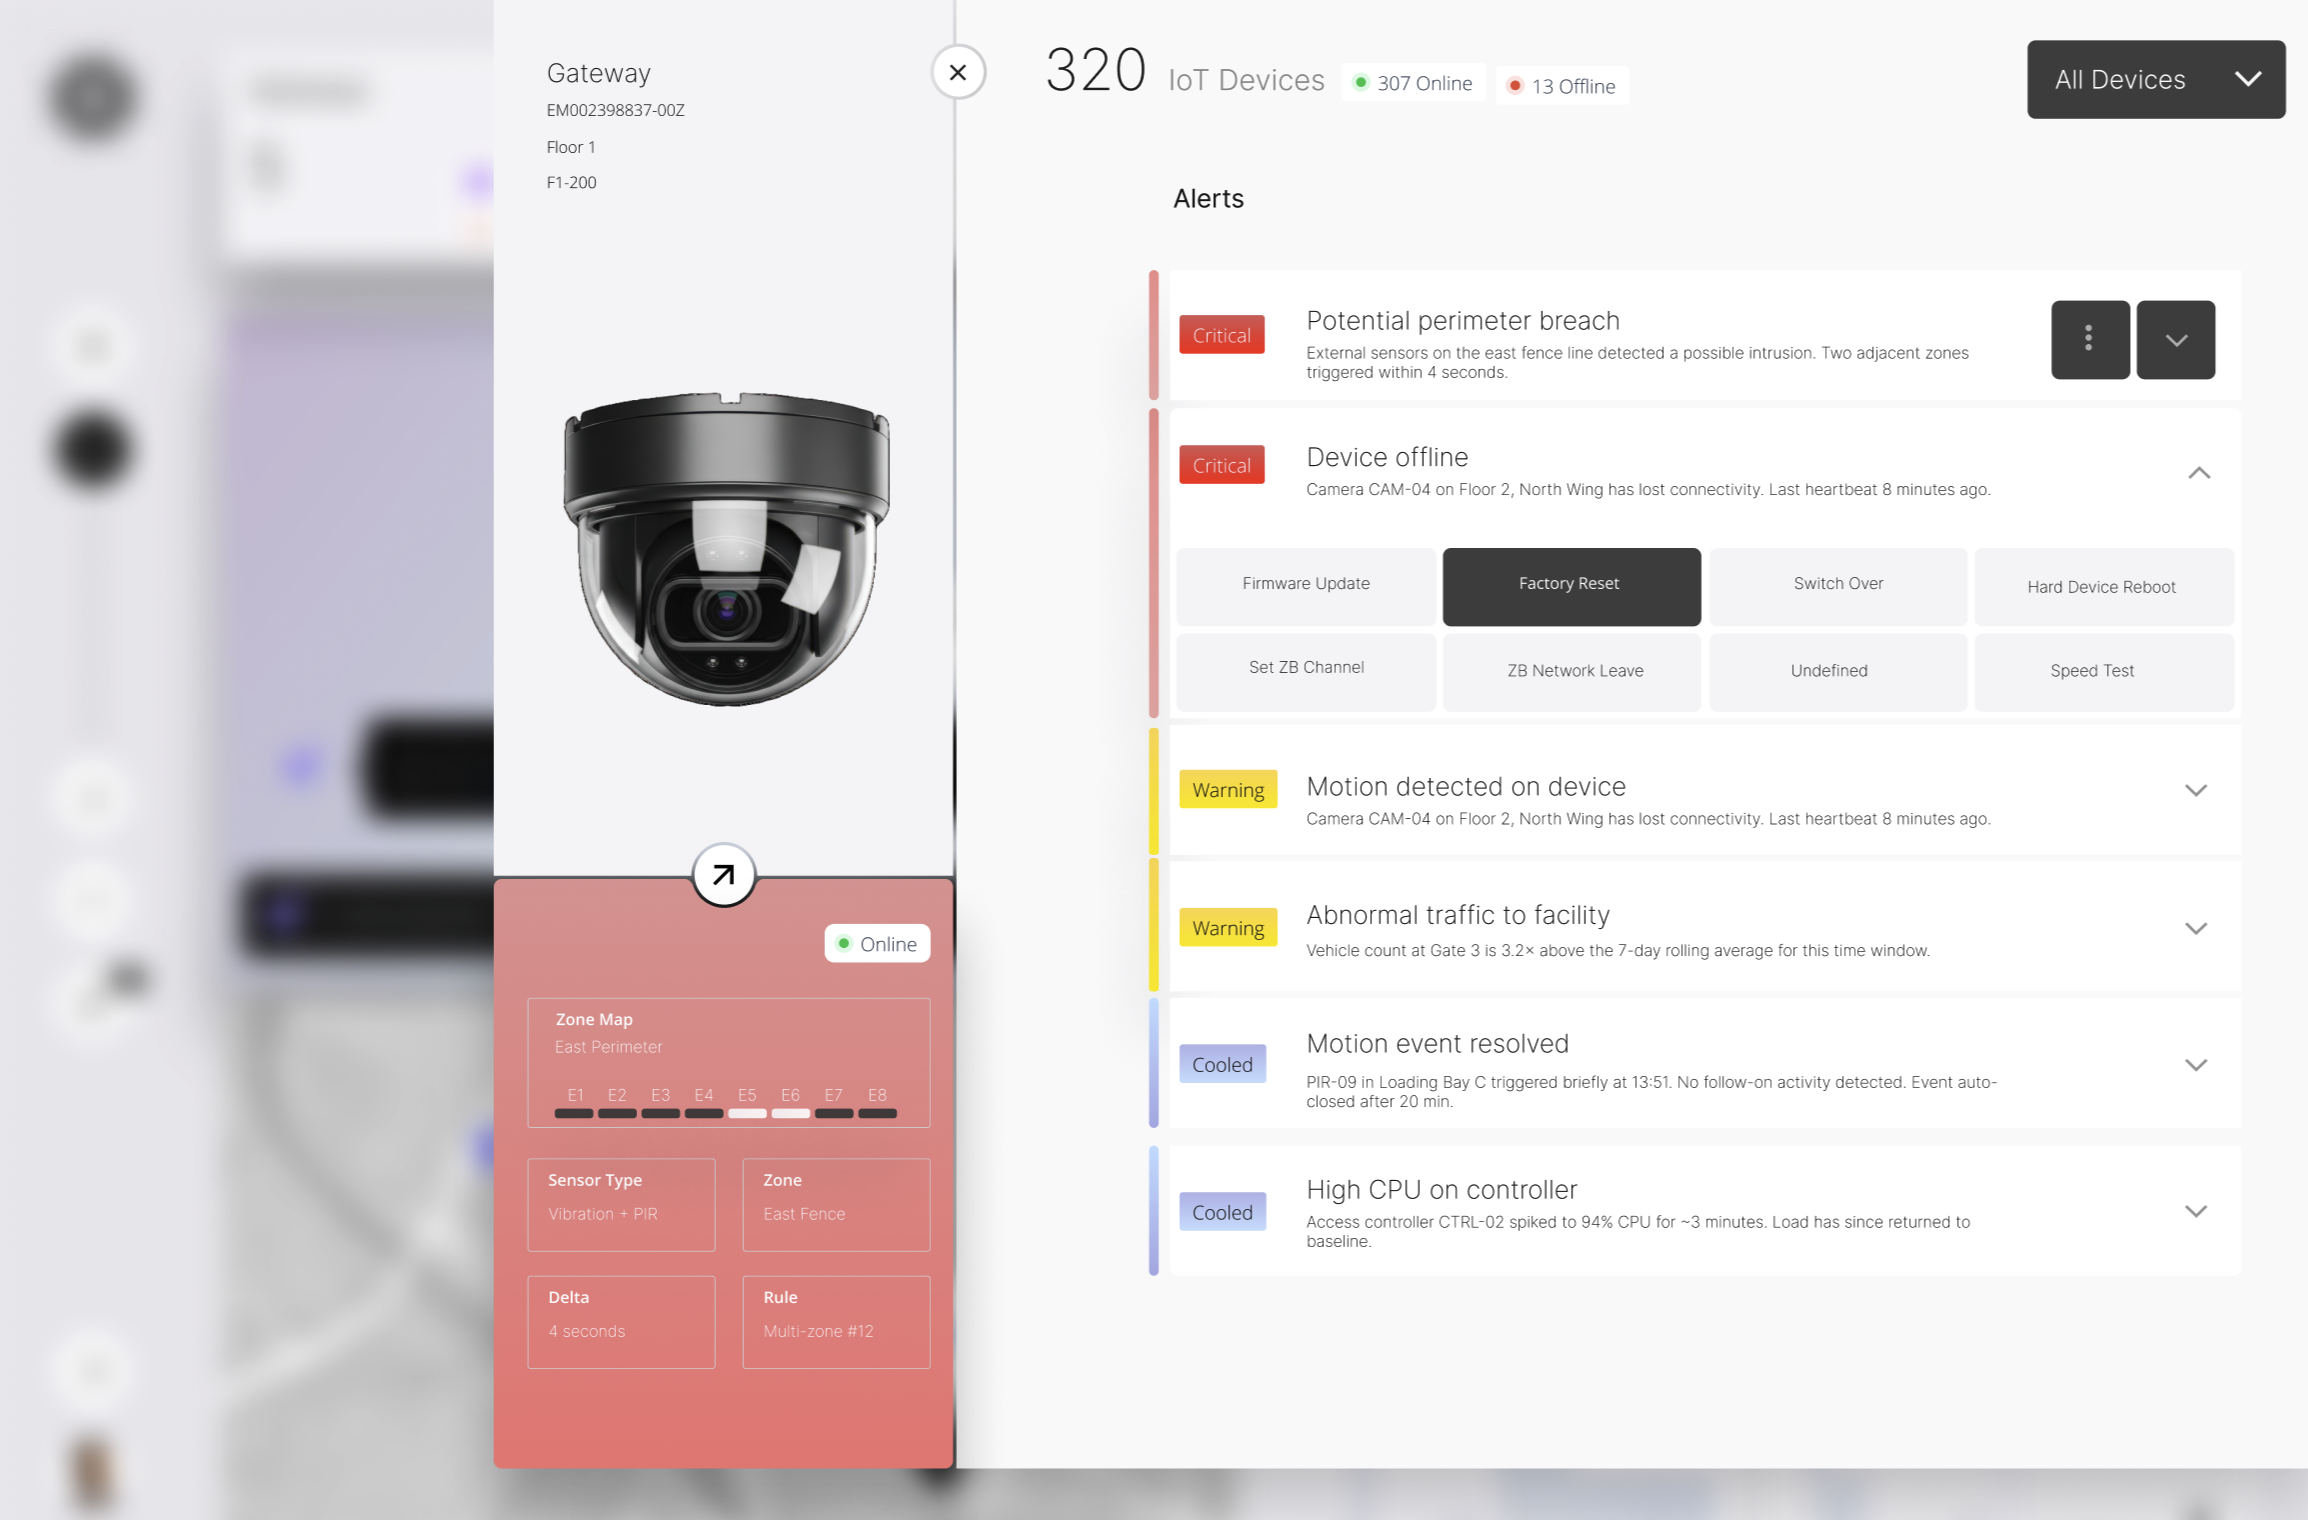
Alerts
Working with clients and DevOps, we identified the seven most common support tasks. Reboot, restart, network connectivity checks, daisy-chaining, and more — working with the hardware team, we made these tasks executable directly through software, tied to a new topographic view of the facility.
Topology
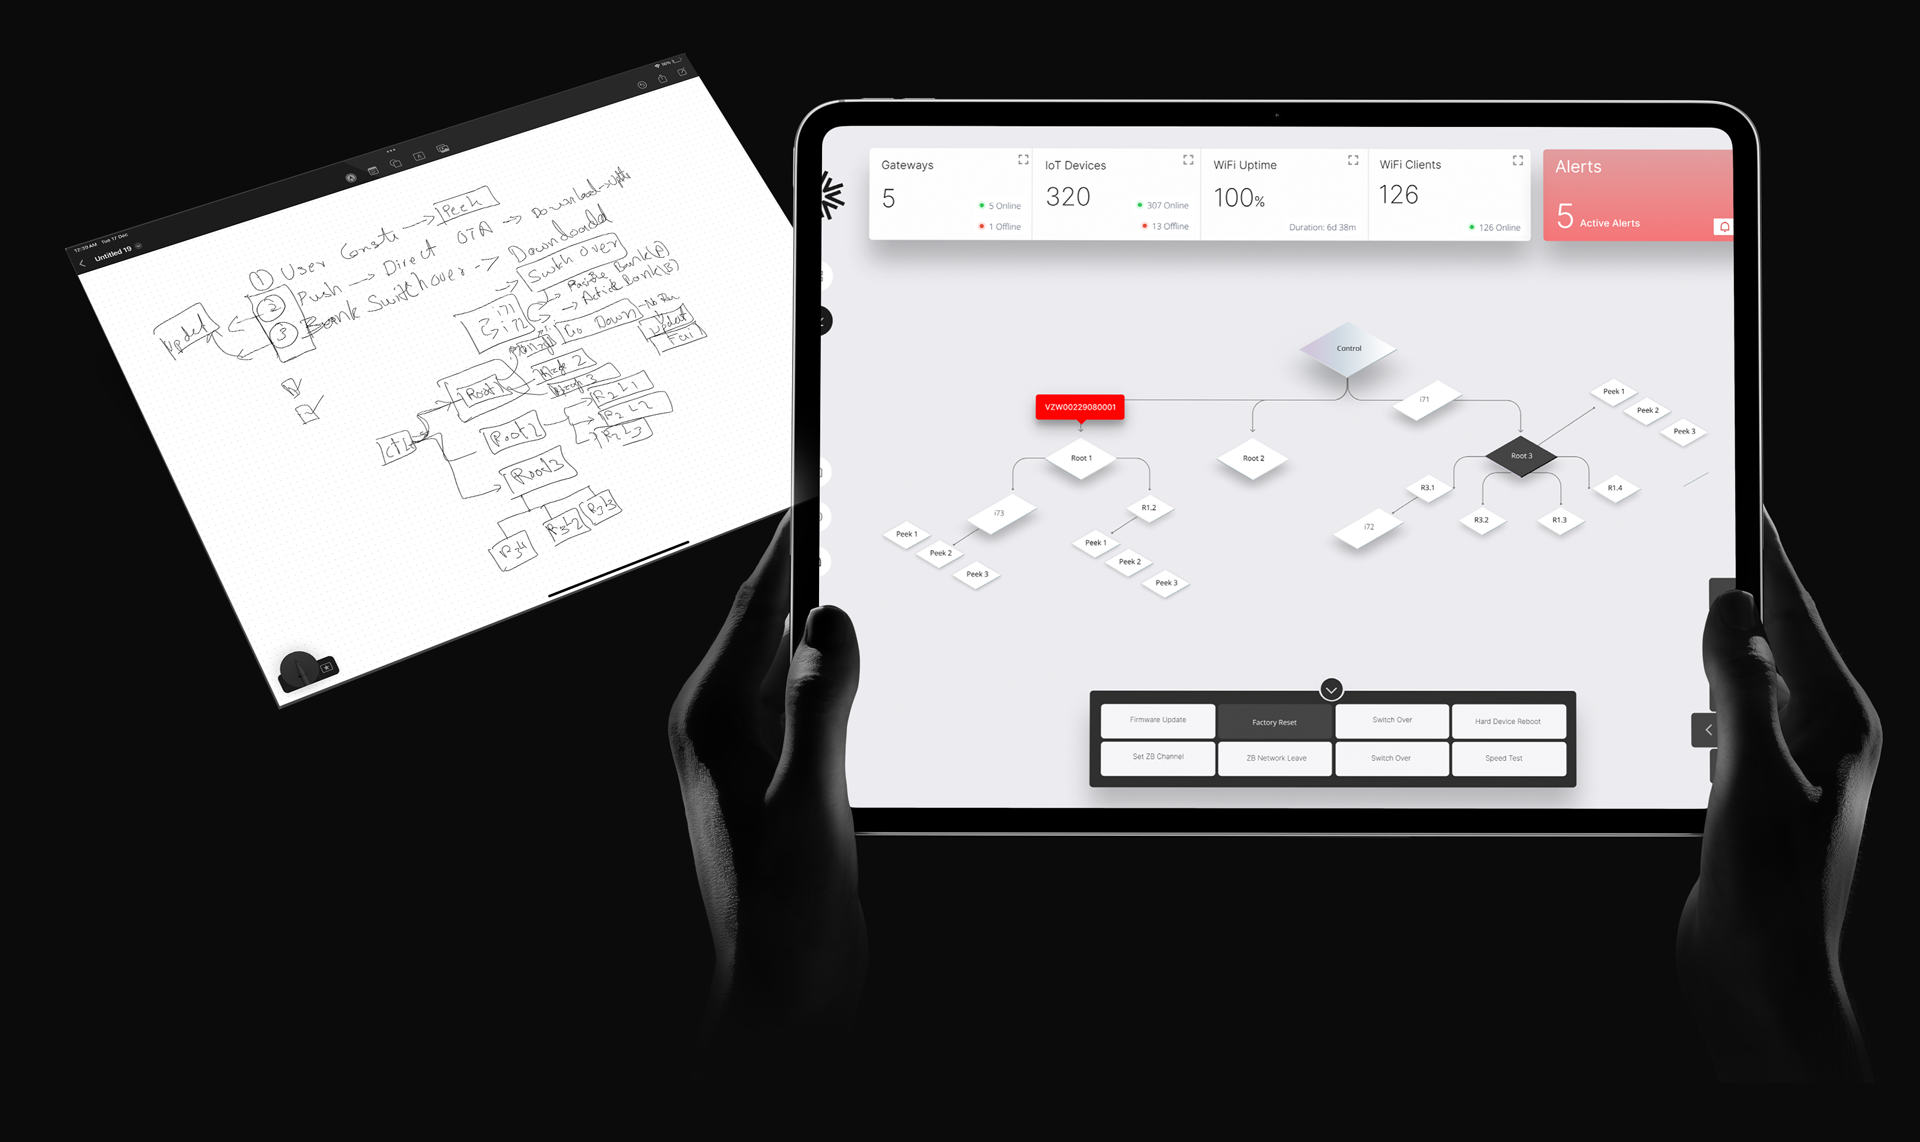
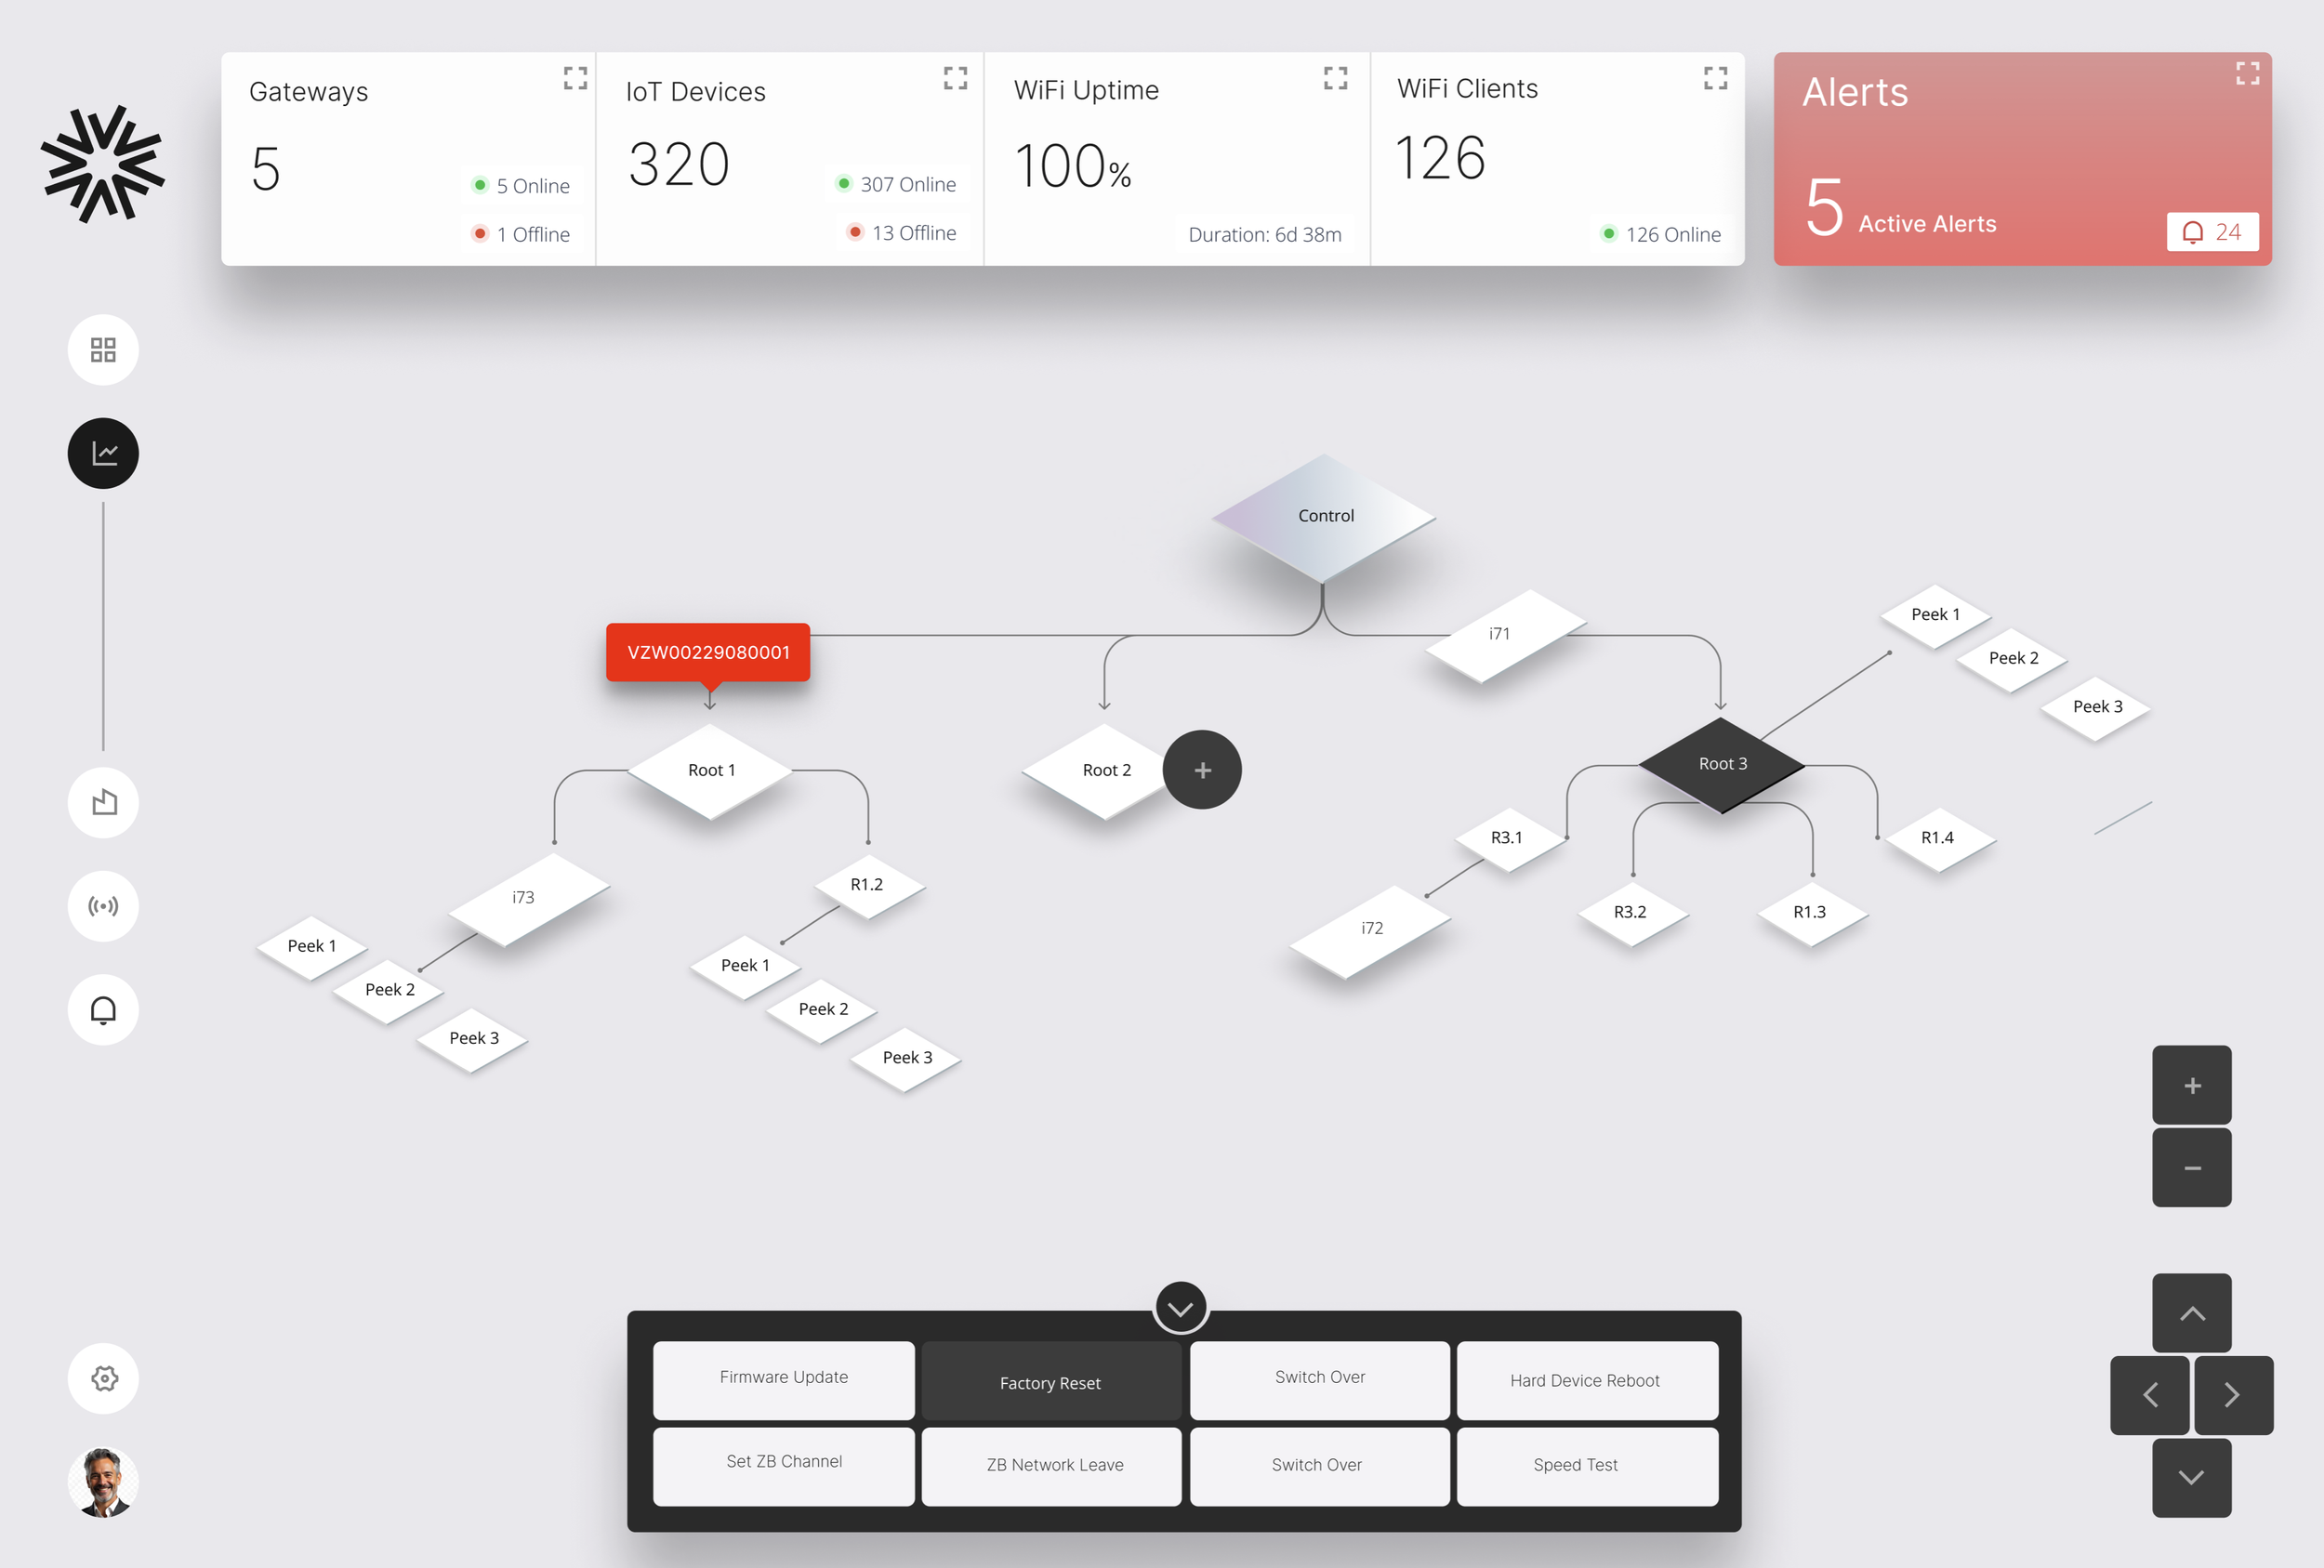
On-site engineers used to rely on a topology map sketched by hand on an iPad, or a spreadsheet, just to see how devices in a facility connected. Both went stale fast. We replaced them with a visual topology interface — a live, accurate picture engineers could actually navigate and troubleshoot from.
04
Where AI fit in
AI genuinely changed how we worked, both in process and in the product itself.
In process
I used Figma Make for rapid prototyping, letting me move from concept to testable screens faster than a traditional high-fidelity pass would allow. Claude and Copilot supported research synthesis and helped surface design pattern examples during discovery. Later, working alongside engineering, we used Figma's MCP integration with VS Code to move directly from design context into working code — closing the gap between design intent and implementation.


Claude Code
Figma Make


VS Code
Github Copilot
In product
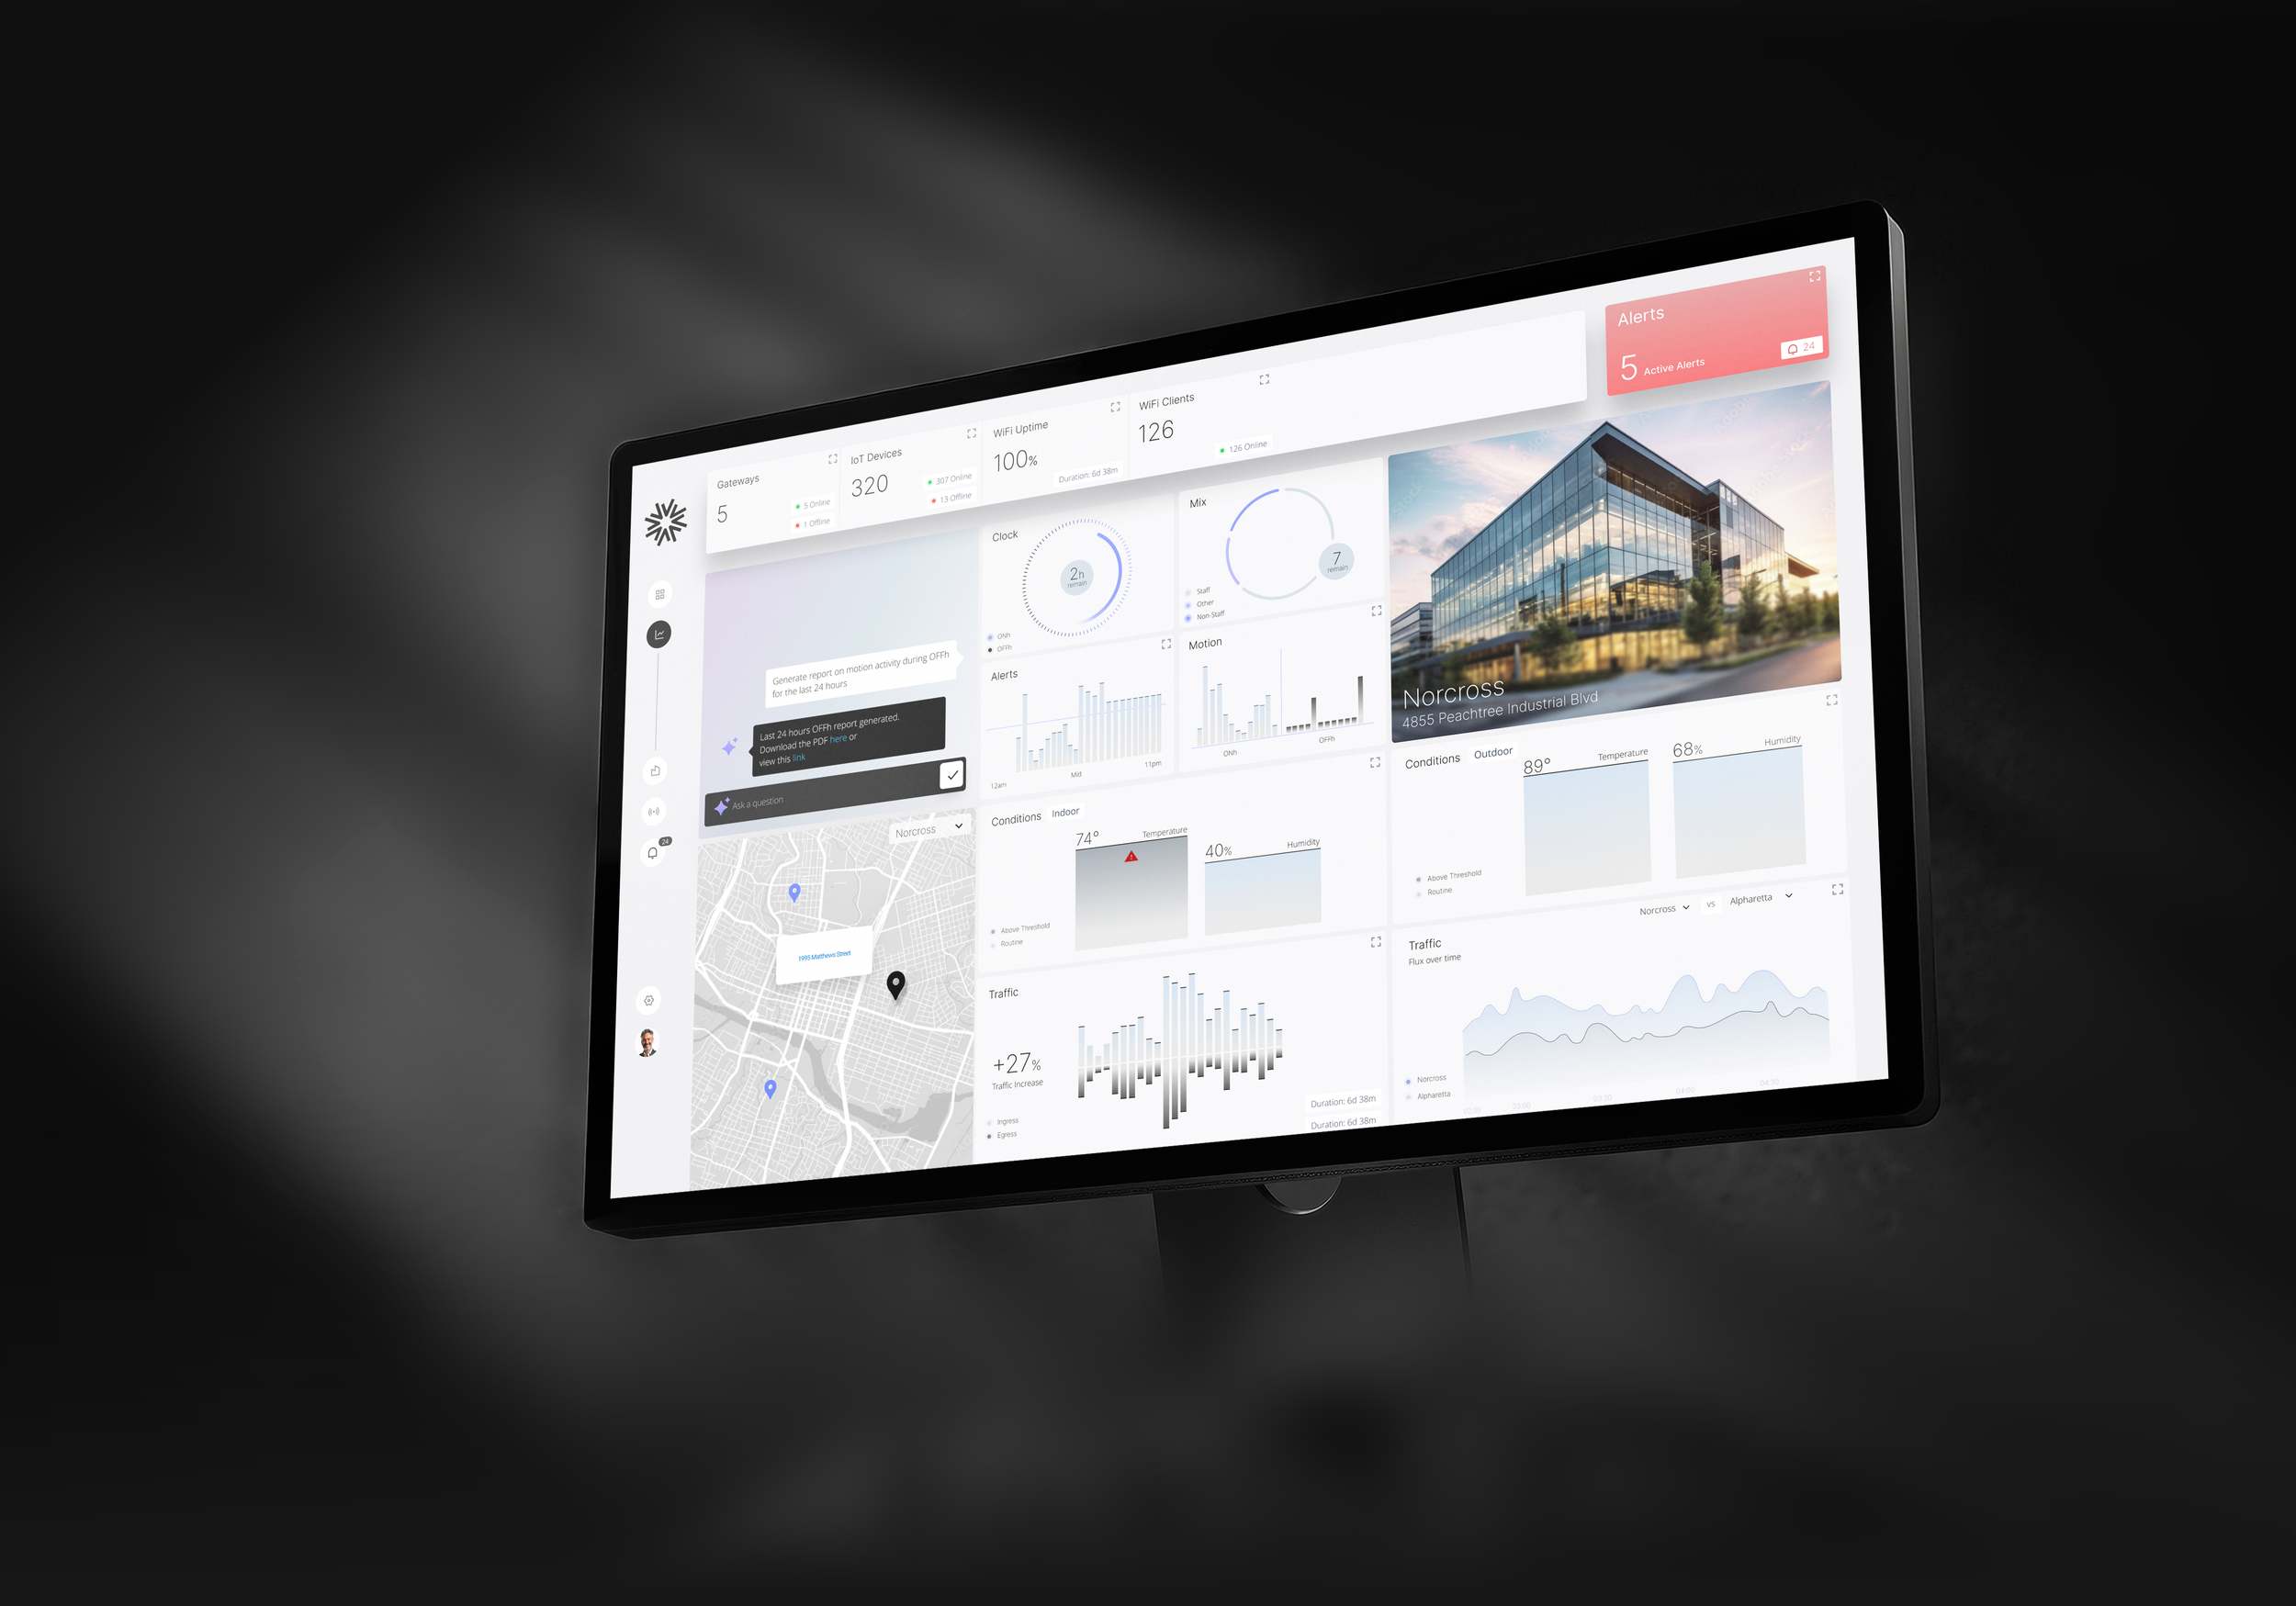
AI also became part of what we shipped. We started using it to monitor IoT-connected hardware and feed that data back to facilities staff — surfacing things like occupancy patterns and environmental factors that existed within a location. That same data was extended outward to the mobile app, giving customers direct visibility into the real-time status for their individual IoT cameras and monitors.

Azure
Azure ML


Databricks
PowerBI
05
Impact
Final design and results
Onsite time decrease
65%
Onsite project time: 7–10 days
→ 3 days maximum
Install time decrease
83%
Install time: 6 hours
→ 40 minutes for manual scanning/entry
Support tickets
↓
Support tickets: Significant reduction in dev-ops-bound tickets for hardware issues
Feature release speed
↑
Delivery speed: Freed-up dev ops capacity accelerated the backlog of other customer-facing feature releases